How to use Page Insights
In this help document:
- An introduction to Page Insights
- How to change the date reflected in Page Insights
- How to find a page
- How to use Activity Snapshot
- How to use Frustration Events
- How to use Top Elements
- How to use Page Speed
- How to use Device
- How to launch a Heatmap
- Page Insights FAQ
An introduction to Page Insights

Click on the image above for an interactive tour of Page Insights
Page Insights provides detailed analysis of user behavior and engagement for individual web pages. It's the primary tool for page-level performance understanding, revealing how users interact with your elements and content.
To access, click Analytics in the left navigation. Page Insights opens by default or can be selected from the sub-navigation.
A quick anatomy of Page Insights
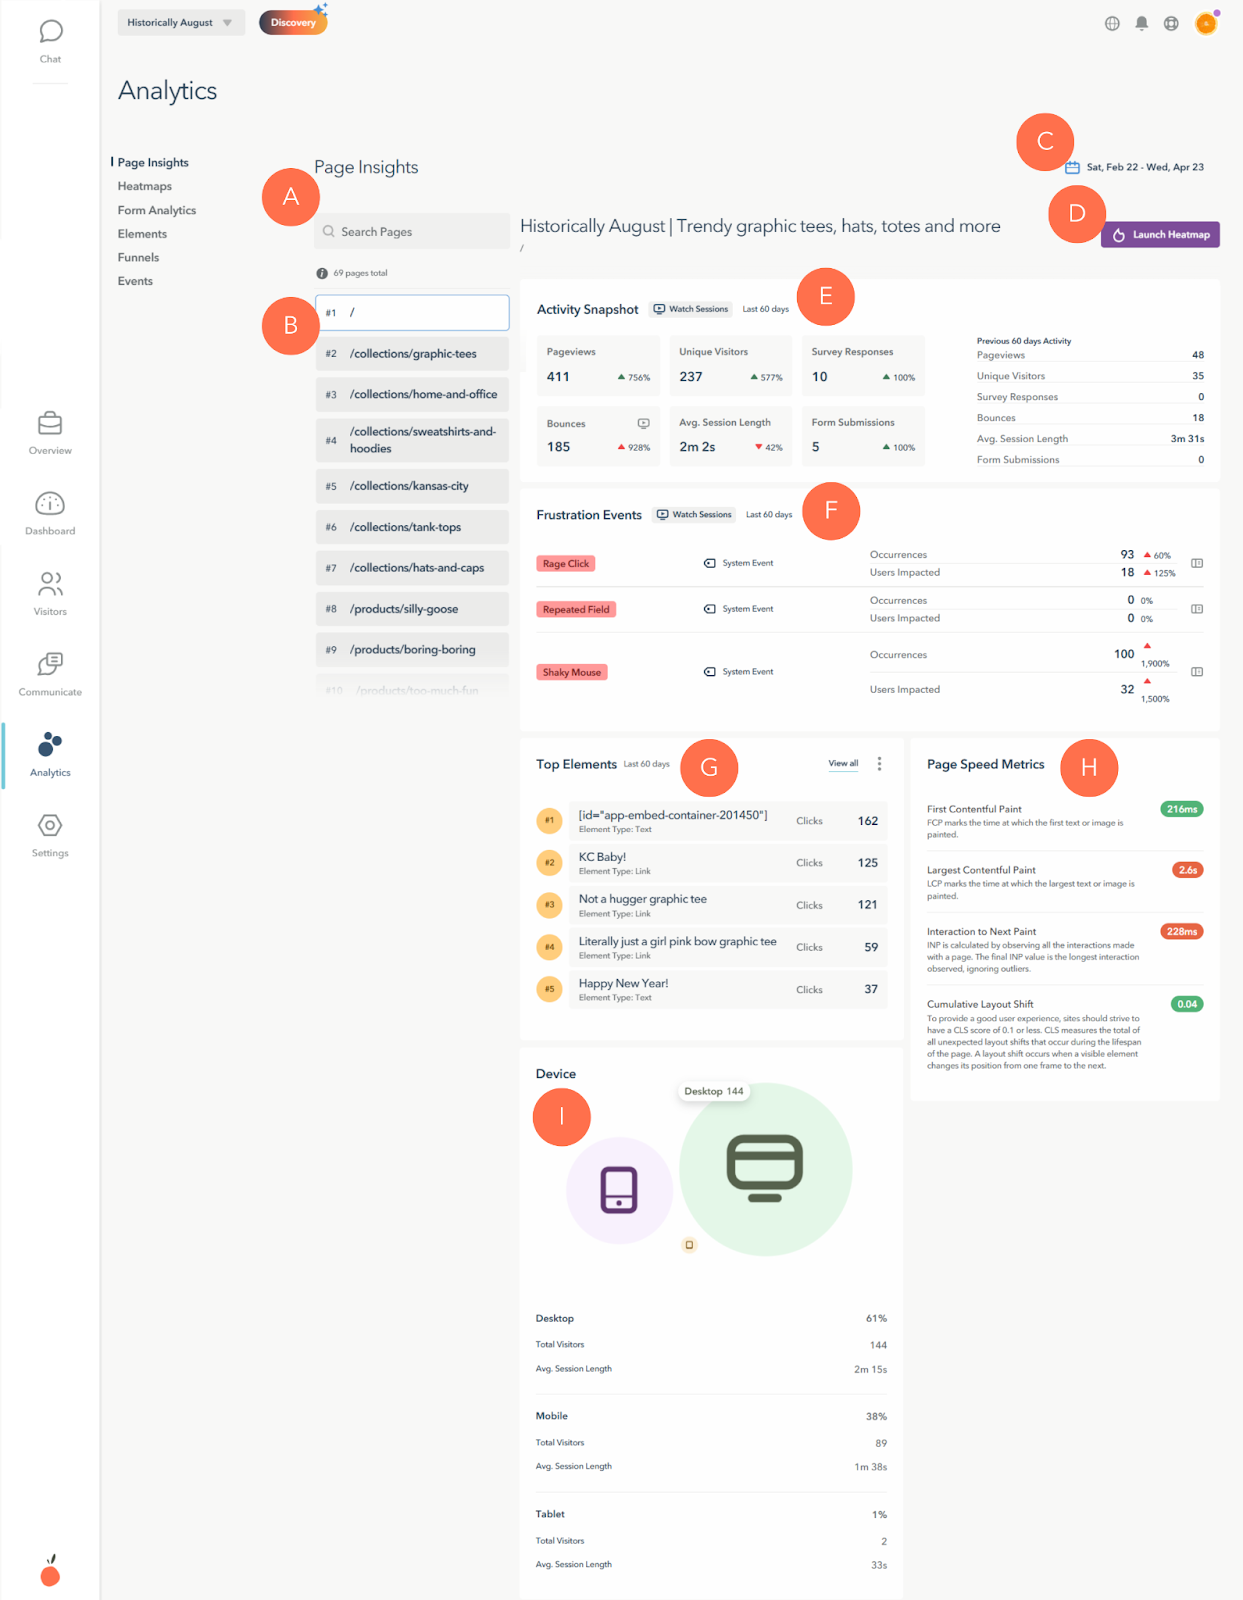
Click to image above to enlarge
- Search for specific pages
- Browse visited pages for detail
- Adjust date range to refresh data
- Launch page heatmap
- View top activity metrics
- Monitor frustration metrics
- Analyze top-clicked elements
- Watch page speed metrics
- View device-level demographics
How to change the date reflected in Page Insights

Page Insights displays data for the selected date range, which defaults to "Today." This setting is located on the right side of Page Insights, above the Launch Heatmap button.
You can change the date range to options such as "Yesterday," "Last 7 Days," "Last 30 Days," and others.

Extended date ranges may require increased data storage, which can be upgraded via the account owner's Billing & Plan page.
How to find a page

Next, select a web page for analysis. On the left side of Page Insights, you'll find a list of web pages with traffic within your selected date range. Please note that this list may not include all of your website's pages.
For example, if your website has 50 pages, but only 10 received traffic during the specified date range, only those 10 pages will be available until you adjust the date range.
You can locate your desired web page using one of two methods:
- Manual Scrolling: The list is ordered by traffic volume, with higher-traffic pages appearing at the top.
- URL Search: Click "Search Pages" and enter a partial URL to filter the list.

Click on a web page from the list to begin using Page Insights.
How to use Activity Snapshot
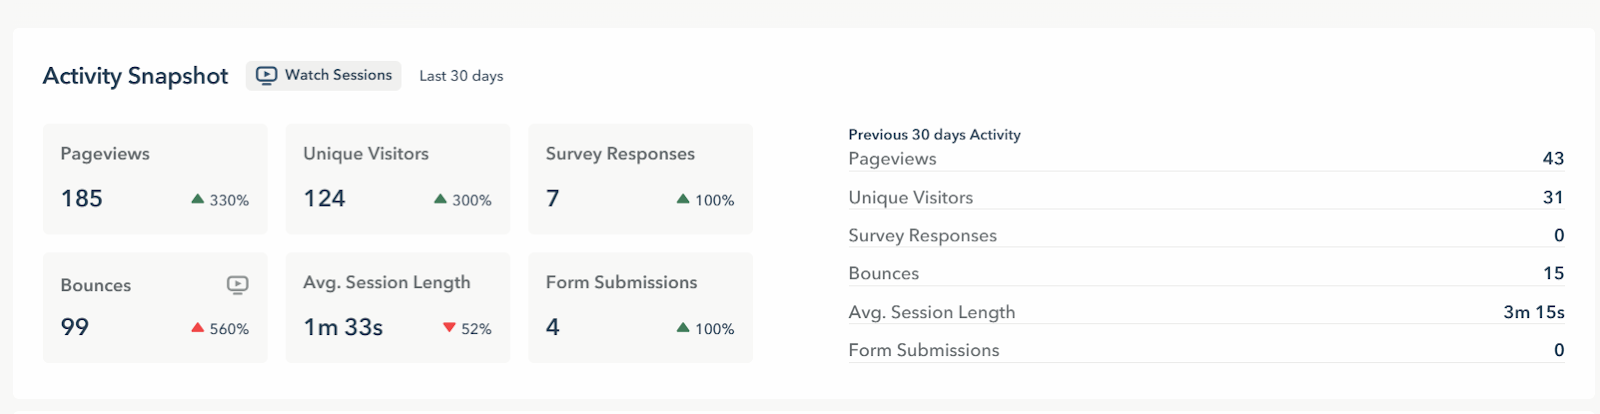
Click to image above to enlarge
The Activity Snapshot provides an overview of your selected web page's performance within your specified time range. On the right, you'll see current activity metrics with arrows indicating positive or negative changes compared to past activity.
On the left, you can view metrics for the previous activity period of the same duration. For instance, if you selected "Last 7 Days," the previous activity represents the preceding seven days of data.
Here's a breakdown of the available metrics:
| Metric | Definition | Change Indicators |
| Pageviews | The number of times the web page was viewed. A single visitor may generate multiple page views within a session. | Positive (green): Up arrow
Negative (red): Down arrow |
| Unique Visitors | The number of distinct individual users who visited the web page. Each unique visitor is counted once, regardless of the number of sessions within the selected date range. | Positive (green): Up arrow
Negative (red): Down arrow |
| Survey Responses | The number of responses to surveys triggered on the web page. This includes only Lucky Orange surveys, excluding those from third-party applications. | Positive (green): Up arrow
Negative (red): Down arrow |
| Bounces | The number of visitors who landed on the web page and did not navigate to any other pages on your website. This metric does not reflect engagement or time spent on the page. | Positive (green): Down arrow
Negative (red): Up arrow |
| Average Session Length | The average duration of a visitor's session on the web page, displayed in hours (h), minutes (m), and seconds (s). | Positive (green): Up arrow
Negative (red): Down arrow |
| Form Submission | The number of forms submitted on the web page, such as search fields or contact forms. Forms within iFrames may not be tracked. | Positive (green): Up arrow
Negative (red): Down arrow |
Note: These are page-level metrics. Not all pages may have survey responses or form submissions.
Actionable Insight
- Click Watch Sessions at the top of the Activity Snapshot to view session recordings of visitors to the web page.
- Click the play icon next to Bounces to view session recordings of visitors who landed on the page and did not navigate further within your website.


How to use Frustration Events

Frustration Events highlight three Lucky Orange events that commonly indicate a frustrating user experience:
- Rage Click: Triggered when a visitor rapidly clicks on specific page areas. Example: Repeated clicking on a non-functional link in an attempt to activate it.
- Repeated Field: Triggered when a visitor modifies a form field at least once during completion. Example: Multiple attempts to correct an erroneous form field entry before submission.
- Shaky Mouse: Triggered by erratic mouse movements, often indicating frustration. Example: Frustration-induced mouse shaking when struggling to locate information.
Tip: Use the drawer icon next to each frustration event to access a concise definition.
These are system events, automatically enabled in your Lucky Orange account.
For each event, you'll see:
| Metric | Definition | Change Indicators |
| Occurrences | The frequency with which the event was triggered on the page within the selected date range. A single visitor can trigger the event multiple times in a session. | Positive (green): Down arrow
Negative (red): Up arrow |
| Users Impacted | The number of unique visitors who triggered the event. A unique visitor may trigger the event across multiple sessions. | Positive (green): Down arrow
Negative (red): Up arrow |
Actionable Insight
- Click Watch Sessions at the top of the Frustration Events section to view session recordings of visitors who triggered any of these events on the web page.

How to use Page Speed Metrics
 Page Speed Metrics represent page-level data for four core web vitals. The results are shown in green (good), yellow (okay but could be better) and red (needs work).
- First Contentful Paint: How long it takes for your first text or image to show up on a webpage.
- Largest Contentful Paint: How long it takes for the biggest thing on a webpage, like a big picture or text, to show up for you to see.
- Interaction to Next Paint: How quickly a webpage responds after you interact with it, like clicking a button.
- Cumulative Layout Shift: How much the layout of a webpage shifts while you're looking at it, which can be confusing.
Note: You can also find these metrics as Events within your Events Manager. You can also turn these into Key Events to see them in Visitors and Visitor Profiles.
How to use Top Elements

Your website comprises various elements, including links, images, banners, and headers. All these elements can have interactions, regardless of whether they are hyperlinked.
The Top Elements section displays the five most clicked elements on the page within the selected date range. Depending on your website's design, platform, and code, elements may appear as text or as code identifiers (IDs).
Tip: For assistance understanding elements, use the action menu in the top-right corner of the Top Elements card to access a related help document.
Actionable Insight
- Click View All to access a comprehensive list of the most engaged elements on the page during the specified date range. From there, you can also view session recordings of users interacting with those specific elements.
How to use Device

The Device section displays the device types visitors used to access your web page: Desktop, Mobile, and Tablet.
Below the chart, you'll find a breakdown of device statistics, including:
- Percentage of users by device type
- Total number of visitors
- Average session length
Actionable Insight
- Hover over the bubble chart to view the total number of visitors for each device type. The largest bubble indicates the highest percentage of users.


How to launch a Heatmap

For deeper analysis of page-level data in Page Insights, use the "Launch Heatmap" button at the top of the page to open a heatmap.
Clicking this button opens the heatmap in a new tab, allowing you to compare visitor interactions with Pge Insights data.
Page Insights FAQs
Q1. Why doesn’t the data match when I compare Visitors data to Page Insights?
A1: To understand the discrepancy, let's define three key terms:
- Sessions: A session represents a visitor's interaction with your website within a specific timeframe. It begins when the user enters the site and ends when they leave or remain inactive for a predefined duration (e.g., 10 minutes).
- Page Views: A page view occurs each time a web page is loaded or viewed by a visitor. A single session can include multiple page views.
- Unique Users/Visitors: These are individual visitors to your website. A unique visitor might view only one page (resulting in a bounce) or multiple pages (contributing to multiple page views). A single unique visitor can also have multiple sessions, depending on their engagement and visit frequency.
Page Insights provides page-level metrics for page views and unique visitors. When you then examine session recordings in the Visitors section, you're viewing a log of sessions from individuals who visited that specific page during your selected date range.
Because a single session can encompass multiple page views (even of the same page), and a unique user can have multiple sessions, the data between Page Insights and Visitors typically won't align precisely.
Q2. Why does it say “No pages Found”?
A2: If Page Insights shows "No Pages Found," it means one of two things:
- Incorrect Date Range: You may need to select a different date range. For websites with lower traffic, widening the date range is often necessary. By default, it displays data for "Today." Try extending it to "Last 7 Days" or "Last 30 Days" to capture more data.
- Plan Limits Reached: You've reached your plan's session limit and haven’t enabled Keep Me Tracking. Each plan includes a monthly session allotment. Once this limit is reached, we offer Keep Me Tracking, which automatically upgrades you to the next plan. However, if you choose not to use Keep Me Tracking, tracking will stop until your plan resets. Adjust the date range to view data collected before the limit was reached.
Q3. Why are element names sometimes hard to understand?
A3: Element names are based on your website's unique design, platform, and code. Here are a few examples of how they can appear:
- Plain text: "Happy New Year!"
- Code identifier: [id="app-embed-container-123456"]
- Translated text: "Gott nytt år!"
The element name reflects the last state a visitor saw it. Therefore, a user with a browser set to a different language will see a different display.
Q4. Why isn't a down arrow always red and an up arrow always green?
A4: Page Insights displays various metrics to help you understand page-level interactions. Some metrics indicate positive trends, such as an increase in page views or unique visitors. Others indicate negative trends, like an increase in bounce rates or rage clicks.
Here's a quick breakdown of the metrics provided and how to interpret a positive or negative change:
| Metric | Location | Positive Change | Negative Change |
| Pageviews | Activity Snapshot | Increase | Decrease |
| Unique Visitors | Activity Snapshot | Increase | Decrease |
| Survey Responses | Activity Snapshot | Increase | Decrease |
| Bounces | Activity Snapshot | Decrease | Increase |
| Average Session Length | Activity Snapshot | Increase | Decrease |
| Form Submissions | Activity Snapshot | Increase | Increase |
| Rage Click | Frustration Events | Decrease | Increase |
| Repeated Field | Frustration Events | Decrease | Increase |
| Shaky Mouse | Frustration Events | Decrease | Increase |