Your guide to Dynamic Heatmaps
In this article:
- What are Dynamic Heatmaps?
- What's the difference between static and dynamic heatmaps?
- What types of Dynamic Heatmaps are available in Lucky Orange?
- How do you launch a Dynamic Heatmap?
- How can I interact with a Dynamic Heatmap?
- How can I filter a Dynamic Heatmap by device type?
- How can I filter Dynamic Heatmaps by segments?
- How do I compare my current page to an older version of the page?
- How do I share or save a Dynamic Heatmap?
- How do I find what people are clicking/tapping on the most (Top Elements)?
What are Dynamic Heatmaps?
Heatmaps are a great tool to spot ways to make the website you're working on a more enjoyable experience for visitors. Heatmap products on the market today are either dynamic or static.
- Static heatmaps provide a snapshot of engagement on a web page. It isn’t available in real-time with no interaction capabilities.
- Dynamic heatmaps give you a more realistic picture of the engagement on your website because it shows how visitors engage with all elements, even those that are interactive, such as drop downs, hover menus and single page apps.
This video overview will teach you about the different types of Dynamic Heatmaps available in Lucky Orange.
What's the difference between static and dynamic heatmaps?
Heatmap products on the market today are either static or dynamic.
Static heatmaps
These are essentially a snapshot of a website page with heatmap data overlaid on it. You can only load static heatmaps one at a time, and interactive elements are difficult to capture.
In some cases, you can only run one report at a time, and it can take several weeks to adequately load a heatmap.
Dynamic heatmaps
On the other hand, a dynamic heatmap shows how visitors engaged with the types of elements typically found on today’s websites.
t gives you a more realistic picture of the engagement on your website because it shows how visitors engage with all elements, even those that are interactive.
Here’s a quick guide to help you compare:
| Heatmap criteria | Static Heatmaps | Dynamic Heatmaps |
| Real-time data | No | YES |
| Immediate data population | No | YES |
| Interact with page elements | No | YES |
| Click/tap data for drop-down menus | No | YES |
| Click/tap data for hamburger or expandable menus | No | YES |
| Click/tap data for pop ups | No | YES |
| Single-page application (SPA) data | No | YES |
| Populate data on all website pages | YES (manually) | YES (automatically) |
| Device type segmentation | No | YES |
| Segmentation by data, geographic location, exit page, landing page, source, UTM parameters, Events, number of visits, operating system and browser | No | YES |
| Instantly switch between heatmap types (clicks, scrolls, moves) | No | YES |
What types of Dynamic Heatmaps are available in Lucky Orange?
Click/taps reports
A click/tap report shows where people tapped their fingers if they’re using a mobile or tablet device or where they clicked their mouse if they’re on a desktop device. On the Dynamic Heatmap, it will show as a reddish-orange overlay on the items that receive high engagement from visitors.
If you hover over an element, you’ll also see that element’s popularity displayed by the percentage of clicks or taps it received out of all the elements on a page.
These types of Dynamic Heatmap reports are helpful if you’re trying to answer these questions:
- Are people engaging with my CTAs?
- Which items on my drop down menus are the most popular?
- Are there parts of my website that are causing visitors to get distracted?
If you want to see this in action, watch this video.
Precise Interaction reports
This type of Dynamic Heatmap is similar to a click/tap report. Instead of showing an aggregate view of the clicks, it shows you exactly where a website visitor tapped or clicked.
These clicks and taps are depicted as individual dots to show you exactly where the visitor engaged.
Why is this useful?
- You can uncover patterns in where people click or tap on the page
- Find “dead” areas of your site people think should be clickable but aren’t
To learn more about Precise Interaction reports, watch this video.
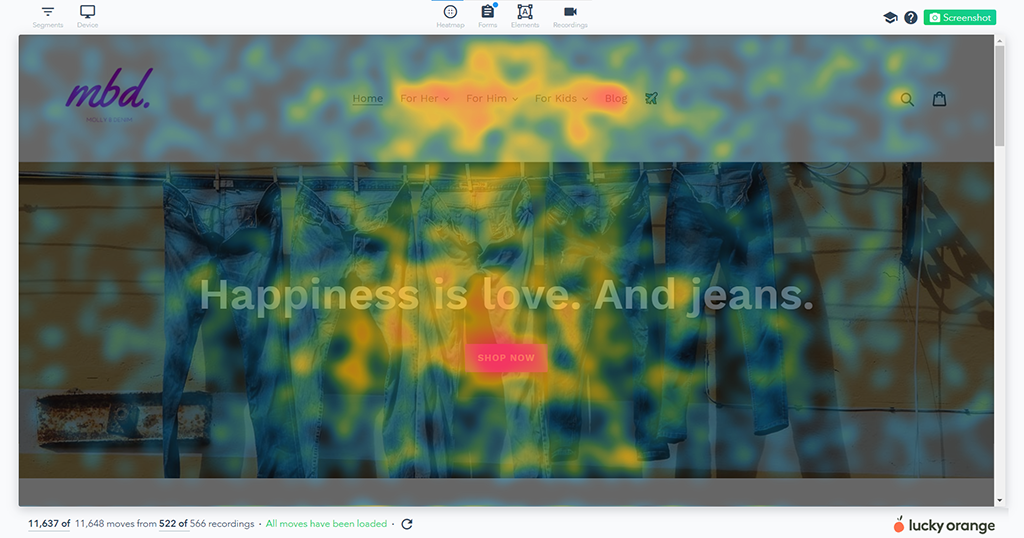
Moves reports
Website visitors tend to move their mouse along with what they’re reading on the screen. This is the type of interaction a moves report shows you.
With the moves report, your Dynamic Heatmap will show you where a person moved or hovered their cursor on their screen when they were using a desktop device. These types of Dynamic Heatmap are sometimes called hover maps or attention maps.
How can you use this type of Dynamic Heatmap?
- See which product or content area was more interesting to people so you can eliminate products or sections that aren’t engaging
- Follow the trail someone took as they read through the page to see what parts of your site are getting the most attention
Here's a video walk through of Moves reports if you'd like to learn more.
Scrolls reports
This type of Dynamic Heatmap shows you how far someone scrolled down the page. You’ll see an indicator line noting the percentage of people who made it to that point of the page as you continue to scroll down.
As you scroll further down the page, the color switches from red to a pink and eventually to white if people leave the page before getting all the way to the bottom. The point where 50% of visitors stopped scrolling on the page is called the effective fold. It’s called out visually with a white horizontal line across the scroll heatmap.
Scroll Dynamic Heatmaps can help you:
- Determine if people made it far enough down your page to see your call to action
- Understand if people are reading long-form content or lengthy product pages or dropping off early
Watch this video on Scrolls reports if you'd like to see it in action.
How do you launch a Dynamic Heatmap?
A Dynamic Heatmap is launched from the Heatmaps table:
- Navigate to Analytics from the left navigation
- Heatmaps should be shown as default. If not, click on Heatmaps from the list on the left
From here you can launch a Dynamic Heatmap using one of the following methods.
Launching from Most Engaged Pages, which shows you the top 10 pages with the most engagement.

Or, you can search for a heatmap by using the page URL. Clicking the magnifying glass will open a search window where you can input the page URL (e.g. mysite.com/book-a-demo).

You can also launch a heatmap directly from a session recording. When you're viewing a session recording, click the page name above the recording playback. It will open a dialog box that allows you to Launch Heatmap or Open in Browser to go to the page seen on the session recording.
 You can also launch a heatmap from Page Insights by clicking the Launch Heatmap button for the page you're viewing.

How can I interact with a Dynamic Heatmap?
Here are a few suggestions to get you started. You can use Dynamic Heatmaps to:
Find your top elements
Your top elements are the parts of your webpage that had the most visitor engagement. There are several ways to access this information.
From the Heatmaps table, click on Analytics in the left navigation. Heatmaps should open by default. If it doesn't, select Heatmaps from the list on the left. To the right of any page listed on the Heatmaps table, click the numbered list button. This is located to the immediate left of the Launch Heatmap button. Once you click the numbered list, the page's top elements will be displayed.

You can also view your Top Elements while you're looking at a heatmap.
Select the Elements icon at the top of the heatmap page. This will open a drawer on the right that displays your top elements. Click into any of the elements to see additional details.

 The third way you can view element analytics is to review them by hovering over the element on the heatmap view of the webpage itself.
Hovering over an element on the heatmap will show you the element's engagement ranking compared to other elements on the page as well as the percentage of clicks based on total page interactions. If the element ranking isn't displayed, press SHIFT on your keyboard to enable it.
Clicking on the element itself will bring up additional details including page rank, click details and a link to see Session Recordings of users interacting with the element.

Navigate through your website
If you want to navigate through different pages on your website or click through dynamic elements like drop downs or expandable menus, press the SHIFT key on your keyboard. This will remove the element hover-over capabilities and allow you to navigate to different pages, open or close pop ups and fill in dynamic forms.
As you interact with your site, the Dynamic Heatmap overlay will populate heatmap data on top letting you analyze visitor data as you interact.
Launch Session Recordings from a heatmap
If you want to better understand how visitors are interacting with the page in general or a specific element, you can watch Session Recordings of visitors doing just that.
Find the Recordings icon at the top center of the page. Click the icon to open the available Session Recordings of people who visited that page.

You can also narrow down the interactions you want to see Session Recordings for based on what element the visitor clicked. There are two ways to do this.
You can click on the Elements icon at the top center of the page. That will open the Element analytics drawer. Click on any of the elements to see details about engagement with that element. On the Element details drawer, you'll see a blue button with the text See recordings for this element. Clicking it will open a list of Session Recordings where visitors interacted with the element.

The second way to view Session Recordings that include interaction with a specific element is by clicking on the element when you're viewing the heatmap. Clicking the element will open the Element details drawer. On the drawer, you'll see a blue button with the text See recordings for this element.

How can I filter a a Dynamic Heatmap by device type?
By default, a Dynamic Heatmap will display data and the view of desktop visitors. However, your visitors likely come from a variety of devices. Your Dynamic Heatmap can show you how traffic engagement changes by device type and how your web page appears on those devices.
You can find the Device filter in the upper left corner of a Dynamic Heatmap. Click here for more details about using the Device filter.
If your website relies on the browser’s user agent to show a mobile version of the website, click the checkbox next to Emulate mobile devices. Learn more about emulating mobile devices here.
You can also set a default device type for your heatmap so you'll always see that type of heatmap first.
- Click on the device menu in the upper left menu
- Select the device type you want as your default
- Click on the star next to the Set as default to save your choice
How can I filter Dynamic Heatmaps by segments?
Within a Dynamic Heatmap, you can use segmentation, which are filters you can add to get as broad or as granular as you need to better understand people on your website.
Note: The segments filter within Dynamic Heatmaps isn’t linked to the Segments within the Lucky Orange app. Segments created in the Visitor’s Table or Settings won’t be available in Dynamic Heatmaps.
Segmentation options include:
- Standard: Date, Historical View, Source, Medium
- Visitor-based: Browser, Operating System, Country, Region name, Number of visits
- Events, including System Events, Integration Events and Custom-Added Events
- Custom user data
You can also save the Dynamic Heatmap segmentation to use in future Dynamic Heatmaps on other web pages. Learn more here.
How do I compare my current page to an older version of the page?
Have you updated or redesigned your website and want to compare it to the past version? Historical version lets you do just that.
You can adjust the date range to be limited to one day up to the limits of your data storage plan. By default, you’ll have 30 days of data unless you’ve upgraded to an extended data storage plan.
Click here for more information.
How do I share or save a Dynamic Heatmap?
Whether you want to share the Dynamic Heatmap with a colleague or client or download it for your records, you can save the Dynamic Heatmap as a static image. You can find the green Screenshot button in the upper right corner of the Dynamic Heatmap. The following video walks you through the steps to do this.
If you want to include the ranking of a specific element in your screenshot, do the following:
- Hover over an element. If the element ranking doesn’t appear, press SHIFT on your keyboard to toggle page interactions
- Click on an element, which should now be highlighted in green
If you want to include the top 10 element highlight, do the following:
- Click the Element icon in the middle of the top of the page to get the full list of your top 10 elements.
- Click the Screenshot button in the upper right corner of the Dynamic Heatmap
- In a few moments, a pop-up with a truncated version of the webpage will display
- Select the Open in new window button to see the screenshot of the full webpage to copy and paste it into a file or email
- Select the Download button to begin downloading the heatmap data of the full webpage
Note: Interactive properties will no longer be available in the exported file since it is being downloaded as a static image.
How do I find what people are clicking/tapping on the most (Top Elements)?
There are several ways to see which elements had the most visitor engagement. The data is based on top elements for individual web pages or landing pages. There are several places in Lucky Orange where you can find this data.
Find Top Elements from the Heatmaps table
- Navigate to the Heatmaps table if you haven’t already
- Click on Analytics from the left navigation
- Heatmaps should be open by default. If not, select Heatmaps from the list on the left
- To the right of a specific web page row in the Heatmap table, click the numbered list button. This is located to the immediate left of the Launch Heatmap button.

Find Top Elements within a Heatmap view
- Open a Dynamic Heatmap
- In the middle of the top of the page, click the Elements icon. A list of your top elements should display in a drawer on the right.
- Click into any of the elements to see individual element analytics.

Find Top Elements on the by clicking the element on the heatmap
- Within a Dynamic Heatmap, hover over any element. Element details such as the ranking on the page as well as the percentage of clicks based on total page interactions. Click into any of the elements to see individual Element details and statistics.
- To look closer at the element, click on an element to bring up the Element details, including page rank, click details and links to see Session Recordings
Pro tip: If element details don’t display as you hover over them, press SHIFT on your keyboard to toddle the page interaction. Press SHIFT again to remove the overlay and interact with your page.
