How to interact with Dynamic Heatmaps
Once you’re in a Dynamic Heatmap, the top four things Lucky Orange users do with Dynamic Heatmaps include:
- Click through four different types of Heatmap reports
- Find your top elements
- Interact across the website
- Jump to Session Recordings
Click through four different types of Heatmap reports
Lucky Orange Dynamic Heatmaps offer four types of reports:
- Clicks/taps: See where people tapped their fingers (mobile or tablet devices) or where they clicked their mouse (desktop)
- Precise interactions: Know exactly where a website visitor tapped or clicked rather than the aggregated data shown in a click/tap heatmap
- Moves: Follow how visitors moved their mouse along with what they read on the screen by seeing where they moved or hovered their mouse cursor. This report is only available for desktop visitors.
- Scrolls: Track how far down the page people scrolled and see how what information is above the effective fold, which is the point where 50% of the visitors stopped scrolling Click here for more information about the four types of Dynamic Heatmap report.
To see the different types of reports:
- Click the Heatmap icon in the middle of the top of the page
- Select the Event type

- If you have filtered data by mobile or tablet devices, the “clicks” event will automatically display as “taps”
- When showing an aggregated view of all visitors or desktop users, it will display as clicks
- To use Precise interactions, click the check box next to “Show precise interactions.” This option will only be available with click/taps reports


 Find your top elements
Within the clicks/tap, precise interactions and moves reports you can identify your top elements automatically or manually. There are several ways to see which elements had the most visitor engagement.
The data is based on top elements for individual web pages or landing pages. You can do this through:
- The Heatmaps table
- Automatically within a Dynamic Heatmap
- Manually within a Dynamic Heatmap
From the Heatmaps table

- Navigate to the Heatmaps table if you haven’t already
- Click on Analytics from the left navigation
- Heatmaps should be open by default. If not, select Heatmaps from the list on the left
- To the right of a specific web page row in the Heatmap table, click the numbered list button. This is located to the immediate left of the Launch Heatmap button.
A list of the page’s top elements will be displayed.
Automatically see top elements within a Dynamic Heatmap

- Open a Dynamic Heatmap
- At the top of the page, click the Elements icon
- A list of your top elements should display in the drawer on the right
- Click into any of the elements to see individual Element details and statistics

Manually analyze individual elements within Dynamic Heatmaps
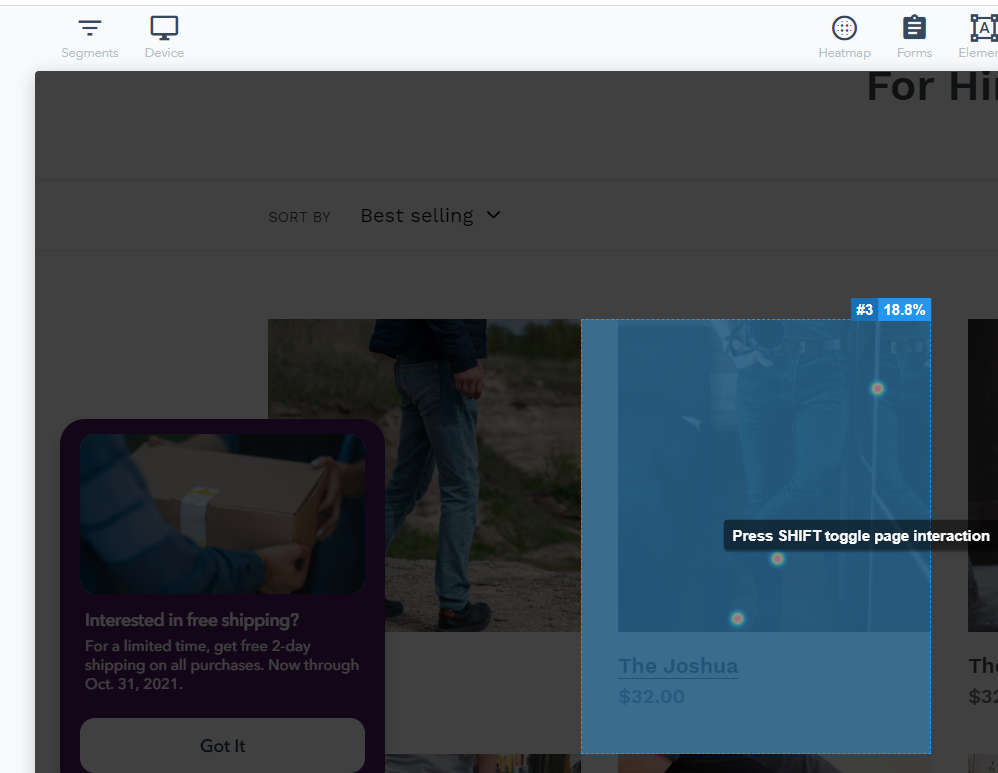
- Within a Dynamic Heatmap, hover over any element. Element details such as the ranking on the page as well as the percentage of clicks based on total page interactions. If the element ranking isn’t displayed, press SHIFT on your keyboard to enable this feature.
- To look closer at the element, click on an element to bring up the Element details, including page rank, click details and links to see Session Recordings
Interact across your website
By default, your Dynamic Heatmap will display with element interaction activated. If you hover over any element, you will see the element-specific ranking displayed.
To toggle on page interaction, press the SHIFT key on your keyboard. This will remove the element hover-over capabilities.
You can:
- Navigate to different pages
- Open hamburger menus
- Engage with drop-downs
- Open or close pop-ups
- Fill in dynamic forms on single page apps
As you interact with your website, the Dynamic Heatmap overlay will populate heatmap data on top letting you analyze visitor data as you interact.
Jump to Session Recordings
Watching Session Recordings will let you put more visitor pieces together to see how they engaged with your website through Dynamic Heatmaps and then find out why they engaged like that through Session Recordings.
- From the Session Recordings icon for web page-specific Session Recordings:
- Click the Recordings icon at the top of the Dynamic Heatmap
- Once opened, it will show available Session Recordings of people who visited that specific web page
- Click the Recordings icon at the top of the Dynamic Heatmap
- From the Top Elements icon for element-specific Session Recordings:
- Click the Elements icon in the middle of the top of the Dynamic Heatmap

- You can also hover over an element to display ranking information. If the element ranking isn’t displayed, press SHIFT on your keyboard to enable this feature.
- Select the element of your choice
- Click the blue See recordings for this element button to begin playing Session Recordings of visitors engaging with that specific element
Note: The list of recordings and basic visitor data can be exported to CSV. This link is available at the top of the Session Recording list that will populate when you open the list of Session Recordings:
