Data export column headers: Top Elements (Heatmap)
In the help document, we’re going to define and explain each column header that can be exported when looking at the Elements analytics from within a Heatmap. To access:
- Navigate to Analytics from the left navigation
- Launch a Heatmap for the page of your choice
- Select the Elements tab at the top of the page
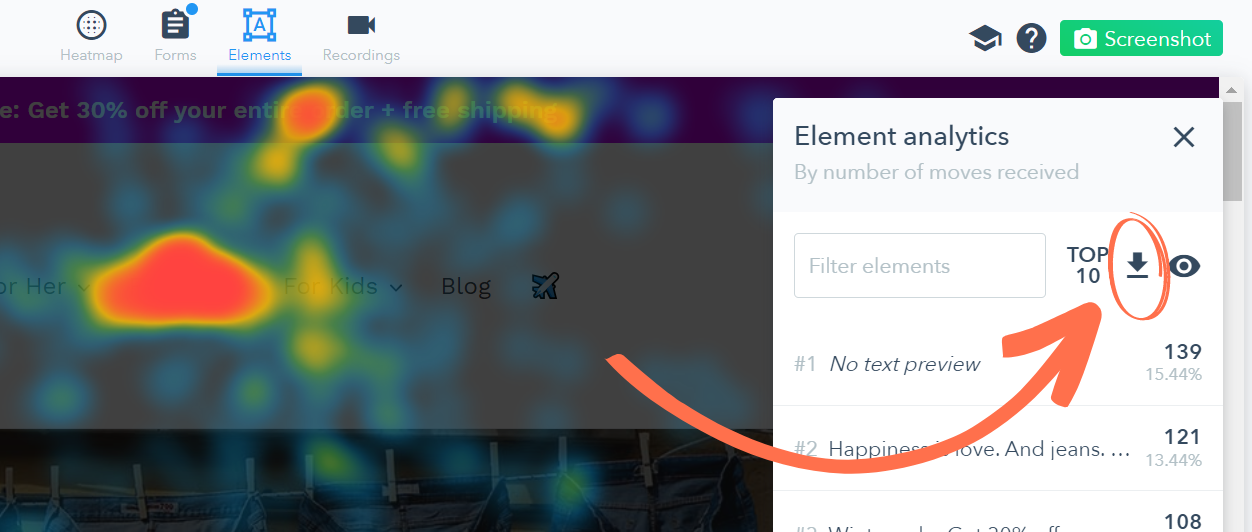
- Click on the download icon shown at the top of the Element analytics drawer that will display to the upper right of the Heatmap
Note: Filters applied through segmentation will apply to the downloaded CSV files. For example, if you’ve added a filter to only look at mobile devices, the Top Elements export will only include data based on mobile users.
| Column name | Definition | Example |
| Rank | Rank shows the popularity of specific elements on a website. The more clicks the element receives, the higher the rank. This can include links, images, menus and more. | 1 |
| Clicks | Clicks show the number of individual clicks on each element during the last 30 days based on when the report was exported. | 284 |
| Percentage | Percentage shows the percentage based on the total number of clicks. If there were 700 clicks on a web page and one element was clicked 300 times, it would represent 43% of the total clicks. | 43% |
| Element Type | Element Type describes the element in an easy-to-understand way | Button |
| Element Content | Element Content includes any text within that specific element | Learn more |
| Element Selector | Element Selector shows the code or identifier used to target and select specific elements on a webpage. It helps developers apply styles or perform actions on those elements. | .nav-bar |
Additional information included in the downloaded CSV file include:
- CSV file name, including the date exported
- Site ID
- Event type: Clicks
- Number of total clicks
- Number of total elements
- URL of the page