Dynamic Heatmaps FAQs
In this article:
- Do ad blockers and tracking blockers prevent me from collecting heatmap data or viewing a heatmap on my site?
- Why can’t I see Dynamic Heatmap data on my embedded YouTube video?
- Can I see the moves Heatmap for mobile devices?
- How do I set a default device type?
- How do I adjust the Dynamic Heatmap background?
- What does “improved performance” mean?
- How can I see a heatmap of more than one product page at a time?
- How do I open a Dynamic Heatmap or Form Analytics of my Shopify Plus checkout?
- How do I use Historical View in a Dynamic Heatmap or Form Analytics?
- What do the numbers at the bottom of Dynamic Heatmaps and Form Analytics mean?
Do ad blockers and tracking blockers prevent me from collecting heatmap data or viewing a heatmap on my site?
Yes, ad blockers and other tracking blockers can prevent Lucky Orange from collecting heatmap data for your website. If a website visitor has a tracking blocker in place, it will prevent Lucky Orange from collecting data about their session.
If you are unable to see a heatmap of your own website, click the ad blocker icon in your browser toolbar and toggle the blocker to "off" or "pause" for your own site. Reload the page after disabling the blocker so the Lucky Orange tracking code can be reloaded.
Other security settings may prevent your heatmap from displaying. If disabling your tracking blocker doesn't resolve your issue, reach out to our support team for assistance by emailing support@luckyorange.com.
Why can’t I see Dynamic Heatmap data on my embedded YouTube video?
YouTube videos, like other common embedded content like social media feeds or advertising plugins, are displayed in an inline frame (iFrame). An iFrame is an HTML document that’s placed within another HTML document.
Basically, it’s content (like a video) from a source (like YouTube) that is embedded into another source (like your website. Because the iFrame is typically hosted by a third party (e.g., YouTube) and not hosted directly on your website, tracking iFrames becomes an issue. It’s a blind spot that all conversion and analytics tools have due to the nature of iFrames.
If you’re using an iFrame to embed a YouTube video or another element, you won’t be able to see data populate on it when looking at a Dynamic Heatmap. You’ll see the iFrame content on the page, but there will be no clicks, taps, moves or scroll data available.
Click here to learn more about iFrames.
Can I see the moves Heatmap for mobile devices?
The moves Heatmap shows how a person moves around your website, including mouse movements and mouse hovering. Mobile visitors use your website differently than desktop visitors:
- Instead of a mouse click, your mobile users will tap.
- Instead of hovering over text with a mouse, they will generally use their fingers to scroll down the page.
As a result, the moves Heatmap isn’t available for mobile or tablet segments. Scroll heatmaps and click/tap heatmaps are available for all device segments, including mobile and tablet.
How do I set a default device type?
Heatmaps automatically default to a desktop view. If you'd rather select phone or tablet as your default view, follow these steps:
- Click on the device menu in the upper left menu
- Select the device type you want as your default
- Click on the star next to Set as default to save your choice

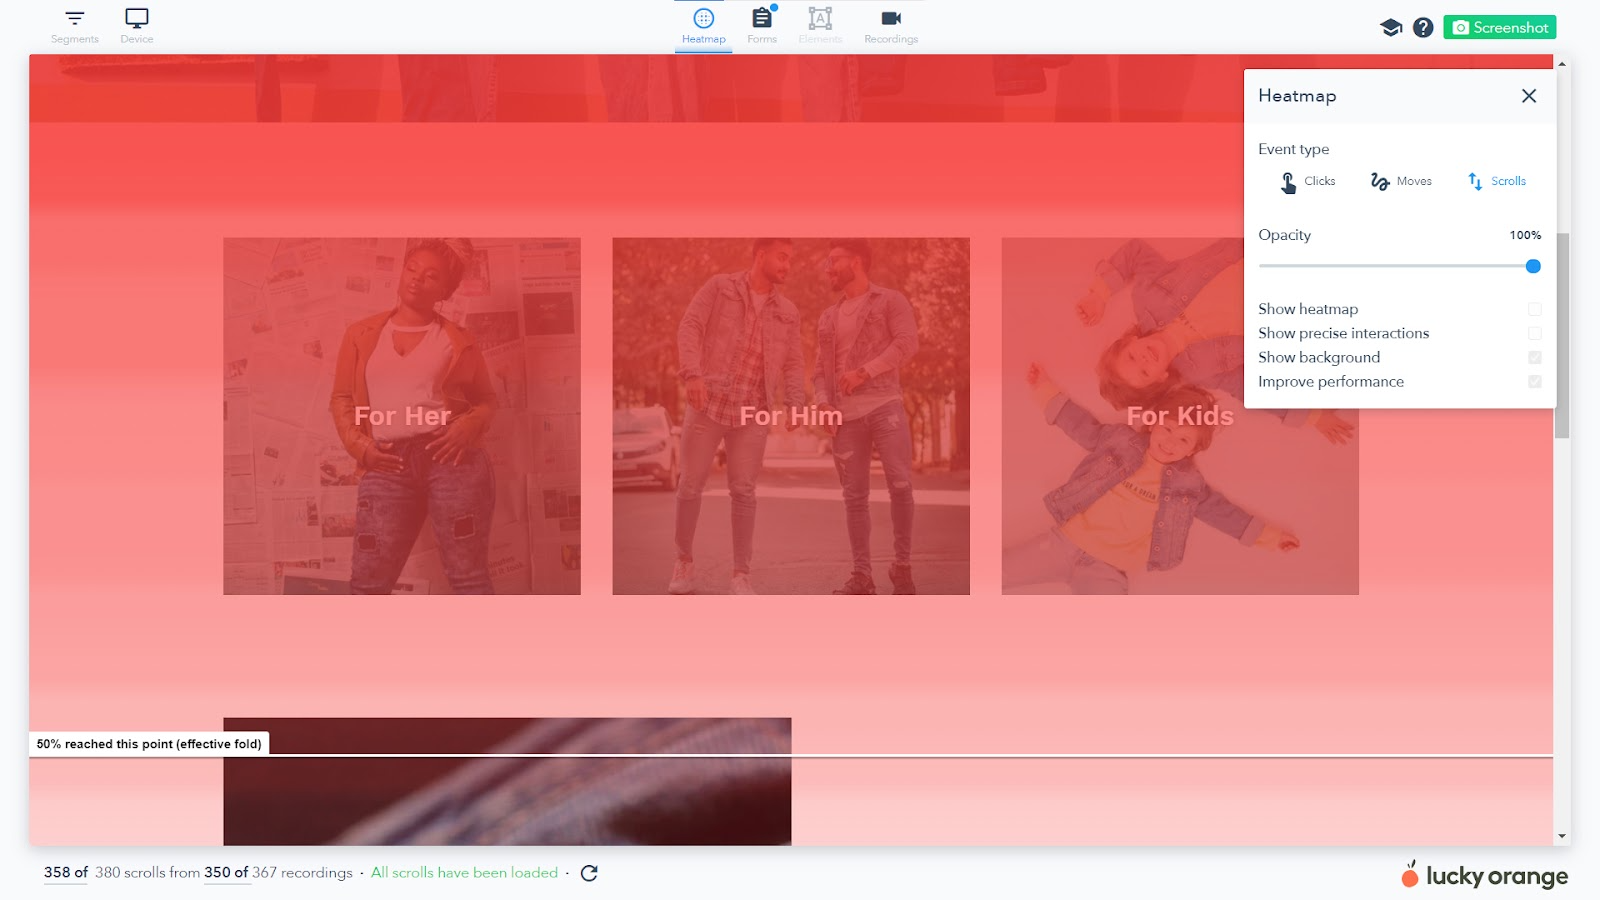
How do I adjust the Dynamic Heatmap background?
By default, your Dynamic Heatmap will display the background overlay when opening up a Dynamic Heatmap. Here’s how to adjust the darkness of the background or remove the overlay completely.
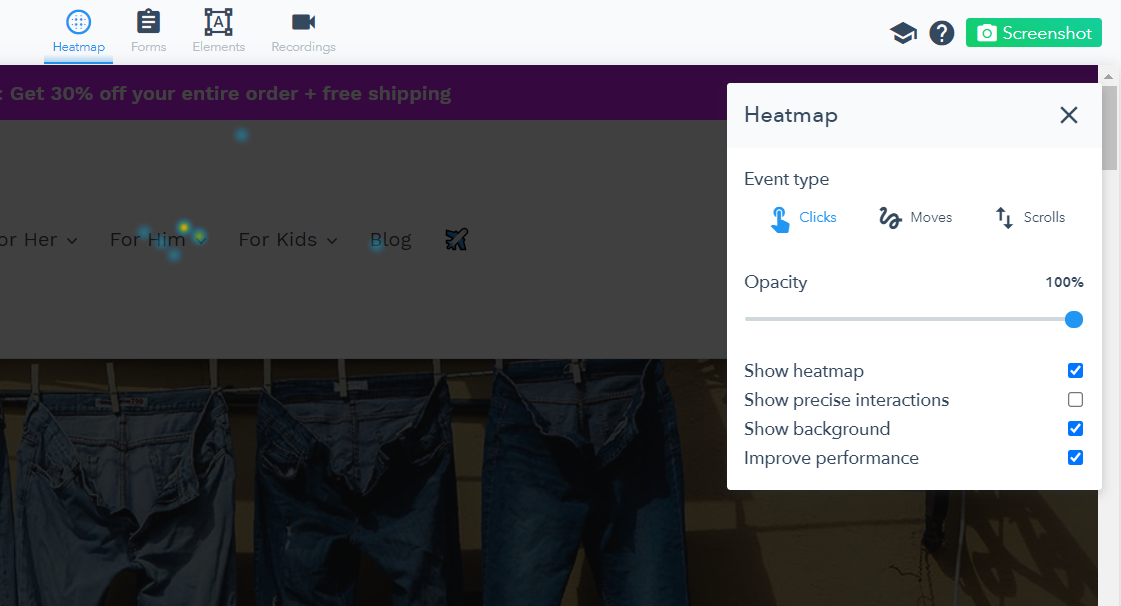
- Click on the Heatmap tab at the top of the Dynamic Heatmap
- On the right hand side of the screen, drag the opacity slider to adjust the brightness of the displayed data and reduce the darkness of the overlay
- Click the checked box next Show background to remove the background overlay altogether. This will completely remove the dark overlay without impacting the heatmap data
What does "improved performance" mean?
When you open a Dynamic Heatmap, you’re looking at a lot of data points. If you look at the bottom of the Dynamic Heatmap, you’ll see just how many data points are captured by Lucky Orange like this:
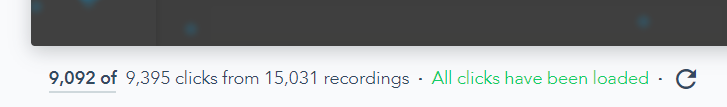
To generate your Dynamic Heatmap faster, especially with a large number of data points, we offer Improved performance.
Improved performance is activated by default when you launch a Dynamic Heatmap.
However, this Improved performance feature doesn’t always play well with older computers including those that meet one of the following:
- Limited RAM
- Operating on Windows XP or earlier
- Older PCs or Macs
If you meet one of these criteria, you will need to remove Improved performance. This won’t impact your Dynamic Heatmap and will only slow the population of data slightly.
To remove Improved performance:
- Click on the Heatmap tab at the top of the Dynamic Heatmap
- On the right side of the screen, select the checked box next to improved performance to deselect the option
How can I see a heatmap of more than one product page at a time?
If you want to analyze multiple product pages together, you'll need to modify the URL structure.
Follow these steps to modify your URL structure:
- Open a Dynamic Heatmap on your desired page
- Click Segments in the upper left corner
- Scroll past your segmentation filters
- Located below Options and the blue Save this segmentation button, you'll find the URL structure:
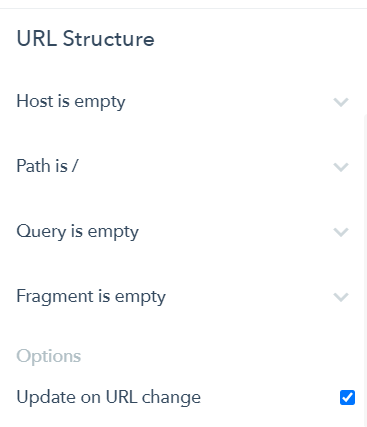
- Click your desired URL structure (host, path, query or fragment). Each part is illustrated in the graphic below.

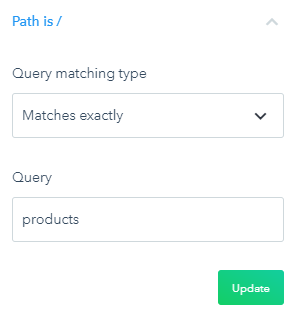
- Change the matching type as needed:
- Matches exactly: This is best used for exact matches of URL structures. It is the default setting when the Dynamic Heatmap initially populates data.
- Contains: This is best used to search for part of a URL structure, such as a specific collection or UTM parameter
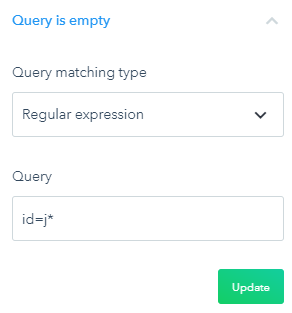
- Regular expression: This is best used with the wildcard (*) denotes a value in your links. See the example below for more information.
- Make sure the blue checkbox is shown next to Updates on RL change at the bottom of the Segmentation box. If not, click the checkbox to enable it.
- Click the green Update button to update your Dynamic Heatmap.
NOTE: The URL structure isn’t saved as part of segmentation, allowing for enhanced flexibility across all pages.
Examples of how to use URL structure changes
For our example, we'll look at how we can make different URL structure changes to example these four pages together:
- www.mystore.com/products/shoes/view?id=ji3oafjs
- www.mystore.com/products/shoes/view?id=jo42xfk&utm_source=facebook&utm_id=winterpromo#details
- www.mystore.com/products/shoes/view?id=jm723sip&utm_source=facebook&utm_id=winterpromo#details
- www.mystore.com/products/shoes/view?id=jm723sip&utm_source=facebook&utm_id=winterpromo#details
- To evaluate multiple product pages:
- Update Path to Match exactly with the query for products
- To evaluate shoe product pages:
- Updated Query to Regular expression with id=j*
- To evaluate products featured on a specific source, in our example, Facebook
- Update Query to Contains with facebook

FAQ: How do I open a Dynamic Heatmap or Form Analytics of my Shopify Plus checkout?
Shopify Plus merchants who use Lucky Orange can access checkout page visitor behavior as outlined in this help doc. The Shopify Plus checkout page uses unique IDs for each visitor which prevents the checkout page from showing in the:
- Top pages summary for Dynamic Heatmaps
- Top form summary for From Analytics
Follow the instructions below to open the Shopify Plus checkout page in either Dynamic Heatmaps or Form Analytics.
- Click on Visitors from the left navigation.
- By default, Heatmaps will be selected. Select Form Analytics from the menu on the left to open Form Analytics.
- Click on the filters icon, located to the far right above the table.
- Select the dropdown by Visited Page.
- Type or scroll to /checkouts.
- This will show a list of all the checkout page instances because each one has a unique ID. Select any checkout-related page to Launch Heatmaps or checkout-related form to launch Form analytics.
The Dynamic Heatmap or Form Analytics will open to show the collective data for all of the interactions with the Shopify Plus checkout form. You can use Segmentation to further refine the data you're analyzing.
How do I use Historical View in a Dynamic Heatmap or Form Analytics?
If you've updated or redesigned your website or form and want to compare it to an older version you can use Historical View to compare the differences.
NOTE: Since Historical View is based on a version of the website that isn't currently live, interaction capabilities on elements may not be available.
To enable Historical View:
- Select a date range that corresponds to the previous page or form design. You will be limited to the data that is within your plan's data retention plan.
- From a Dynamic Heatmap or Form Analytics, click Segments in the upper left corner.
- Click Start Date to select the starting date.
- Click End Date to select the ending date. Pro tip: To refine it to one date, select the same End Date as Start Date.
- Click the checkbox next to Load historical view of this page.
You may need to refresh the page to update the website. Click the looped arrow in the footer of the Dynamic Heatmap or form Analytics to complete the refresh.

What do the numbers at the bottom of Dynamic Heatmaps and Form Analytics mean?
When looking at a Dynamic Heatmap or Form Analytics report, you'll see numbers at the bottom of the page. They may include:
- 710 of 750 clicks from 193 of 208 recordings
- 50 of 61 moves from 200 of 233 recordings
- 30 of 32 scrolls from 542 recordings
These numbers show you how many sessions were recorded and how many clicks/taps and how many moves or scrolls (depending on heatmap type) were generated from the recording.
These numbers many not show 100% of the recordings for the following reasons:
- Your data is segmented. Be default, your heatmap or form analytics data will be filtered to show desktop traffic. If you change or add segments, this will automatically exclude any of the data that was captured. You will see a blue Segmented tag pop up in the lower left corner of the page if your data is segmented.
- You have bounced traffic. This is especially true for moves and clicks/tap heatmaps. If a visitor comes to your website but doesn't engage, it will be counted as a session recording but won't produce any viable clicks or moves.
- Your traffic navigated to other pages using elements above the fold. In these situations, scroll heatmaps will show fewer scrolls. Since not all visitors scroll down a page, you can switch to click heatmaps to see where they're clicking instead. For pages with clicks but no scrolls, it's more likely they're navigating away from the page with the top navigation and/or using elements above the fold.
- Your visitor's browser malfunctioned. In this situation, Lucky Orange receives the data but the browser didn't pass it through correctly. As a result, we can show that the click, scroll or move was captured but can't attribute it properly by device breakdown or through any metadata. As a result, the Dynamic Heatmap or Form Analytics report won't match one-to-one.
What does the Analyze button do a Most Engaged Pages?
The Analyze button on Most Engaged Pages opens the Discovery AI chat window and will provide a text-based summary of your heatmap data for that page.
